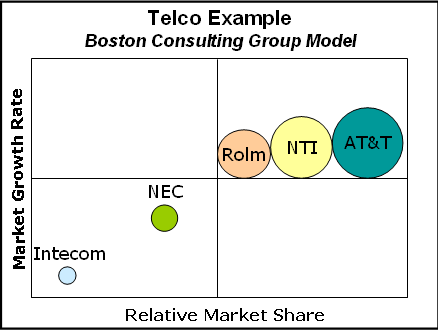
A strategic visual competitive intelligence tool I like is an adaptation from the Boston Consulting Group’s (BCG) Matrix Share model which depicts share momentum.
You can see at a glance with little explanation how to read this model. The size of the bubble or circle represents the company’s share of market relative to the rest of the competitors illustrated. Those companies which appear above the diagonal line are losing share and those below the diagonal line are gaining share. (Below)

In competitive intelligence terms, the BCG Matrix Share is a great primer to communicate a snapshot of competitor’s share of market.
Many years ago when I worked at Bell Atlantic (now part of Verizon), we used the BCG Matrix Share model to show our management the relative share of market of our key competitors relative to the systems we marketed. This was the starting point for a discussion about acquiring the installed base of Northern Telecom, a key PBX (private branch exchange) telephone system manufacturer.
In the spirit of cooperative intelligence, we chose this model since we heard that our executive team was comfortable with it. It was often used in merger and acquisition decision-making, and this was supporting an acquisition that we were recommending. When using any model, I think it’s important to consider how receptive your audience is to it culturally, and if it’s the right model to persuasively illustrate your analysis and recommendations.

Before we could get to the specific reasons why we should acquire Northern Telecom’s installed base in our region, we needed to set the stage, and give our executives a clear picture of the competitive landscape.
We focused on 5 manufacturers so as not to confuse our executives. The big 3 PBX manufacturers—AT&T (now Avaya), Rolm (now part of Siemens) and Northern Telecom—would have to be included in any discussion about telephone systems. Intecom and NEC were the two PBX systems we were marketing at the time. The BCG Matrix Share clearly portrayed their weak positions as compared to the Big 3 PBX manufacturers.
From here we discussed the specific reasons why we should acquire Northern Telecom and not Rolm, for example. Looking at this BCG Matrix Share analysis, Northern Telecom’s share of market is larger than Rolm’s, but this alone was not enough reason to acquire Northern Telecom’s installed base. In my next blog, I’ll show the next competitive intelligence analytical tools we used to persuade our management that acquiring Northern Telecom’s installed base was the right move.
How have you used BCG Matrix Share with your management? What do you see as its strengths and weaknesses?
Learn more about competitive intelligence
Win/Loss Analysis book; Amazon link to Win/Loss Analysis book
Join our mailing list and get our cheat sheets on “How to Build a World Class Win/Loss Program.”

As always BCG’s management tools are very simple and doesn’t explain the reality of firms. But as it’s simple, a growing number of people use these tools and find they are a good foundation for their strategy. I’m very disapointed about this trend. I hope managers will stop to ask to consulting group like BCG and others to define their strategy. In many firms a lot of skilled people haven’t an interesting job because managers don’t trust about them. But they often better than analyst in these consulting group because they know the environnement of the firm. I’m still surprising that these consulting group earn so money and companies trust them.
So please trust in your own staff and instead to follow management tools, open your eyes on other tools like economic tools (I’m an economist but…) or sociologic tools. I’m sure that an other view will give a really advantage in this competitive environnement.
Hi Benjamin,
I like this tool for its simplicity since it often sets the tone for more in depth analytical tools. I have used it to set the stage for the market environment, for example, and then move on to what I would do to change things, for example through an acquisition or merger.
Hi Ellen,
It’s exactly i said ! These tools are used because they are simple not because they are good. Don’t you think that others tools exists and they could you better analyze your market environment ? Do you know the game theory who analyzes strategic interactions among firms ? Do you know econometric tools who allows you to better understand the key of your market ? If not open your mind and you will understand why i don’t like BCG tools